Managing Data
A layer is a slice or stratum of the geographic reality. Layers are a published resource representing a raster or vector spatial data source. Layers also can be associated with metadata, ratings, and comments. This section will introduce you how to upload, download, change the style or share a layer.
Uploading layers
The following steps will explain how to upload your own layer. For example you can download a shapefile from the net. A shapefile format (.shp) can spatially describe vector features: points, lines, and polygons, representing, for example, point of interests, roads, and buildings. After downloading the shapefile:
From the top menu, Scroll down the Data menu then Click on Upload Layer. This will open the upload form.
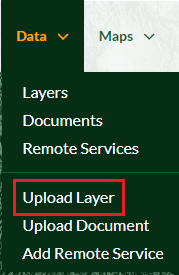
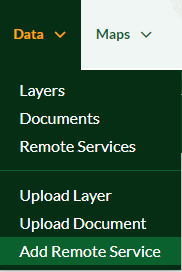
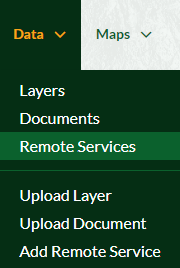
Data menu
Note
Note that, since you are logged in, now the Data menu contains two blocks of options. The first block includes options to view, and optionally to examine, already existing Layers, Documents and Remote Services in the portal. The second block allows the user to upload his own Layers, Documents or to add a Remote Service into the portal.
Click on the Choose Files button. Navigate to your data folder and select all of the four files composing the shapefile (.shp, .dbf, .shx, .prj). Alternatively you could drag and drop the four files in the Drop files here area. You can also upload a zipped folder containing the files above.
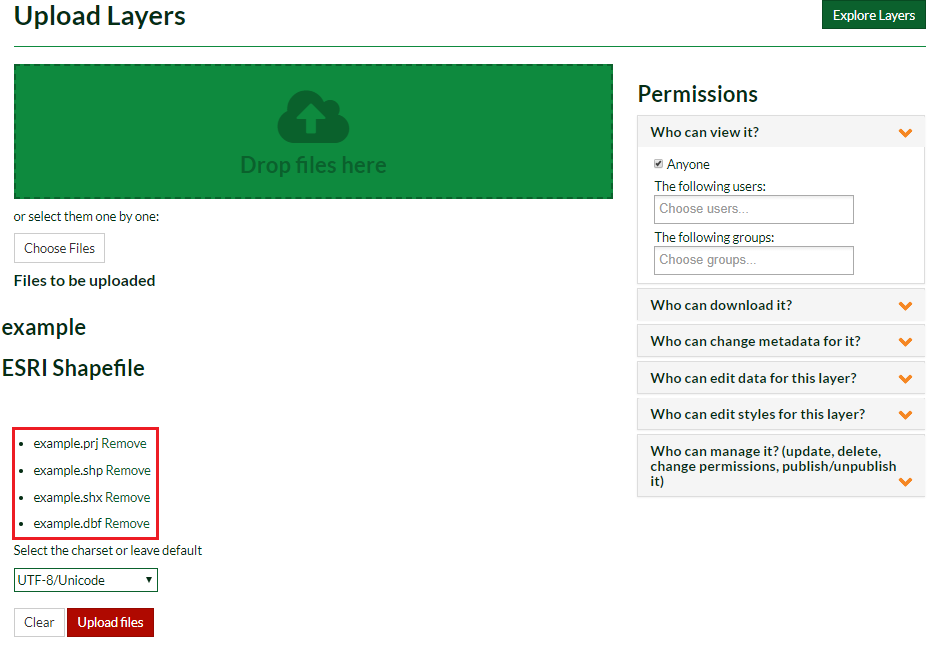
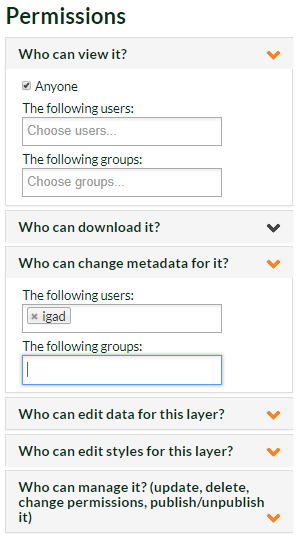
On the right side of the form, you can set the permissions on who can view, download, edit and manage the layer.
Click on Upload Files. Your file will be uploaded in the portal. Once approved by the administrators, you will get notified and will be viewable by other users.
Edit Layer Metadata
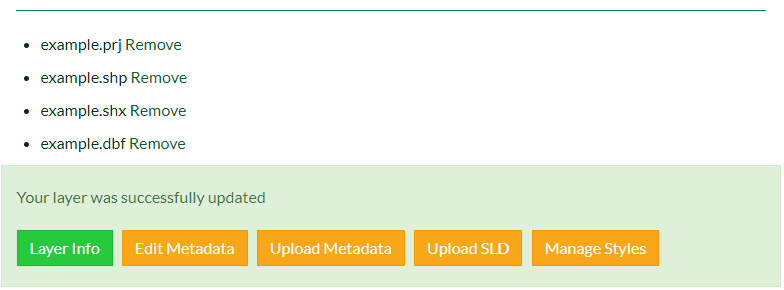
In order to change the metadata of the layer, from the tabs shown in Step 4:
Click on Edit Metadata. You will be addressed to the following wizard. The first two pages are mandatory while the last two are optional.
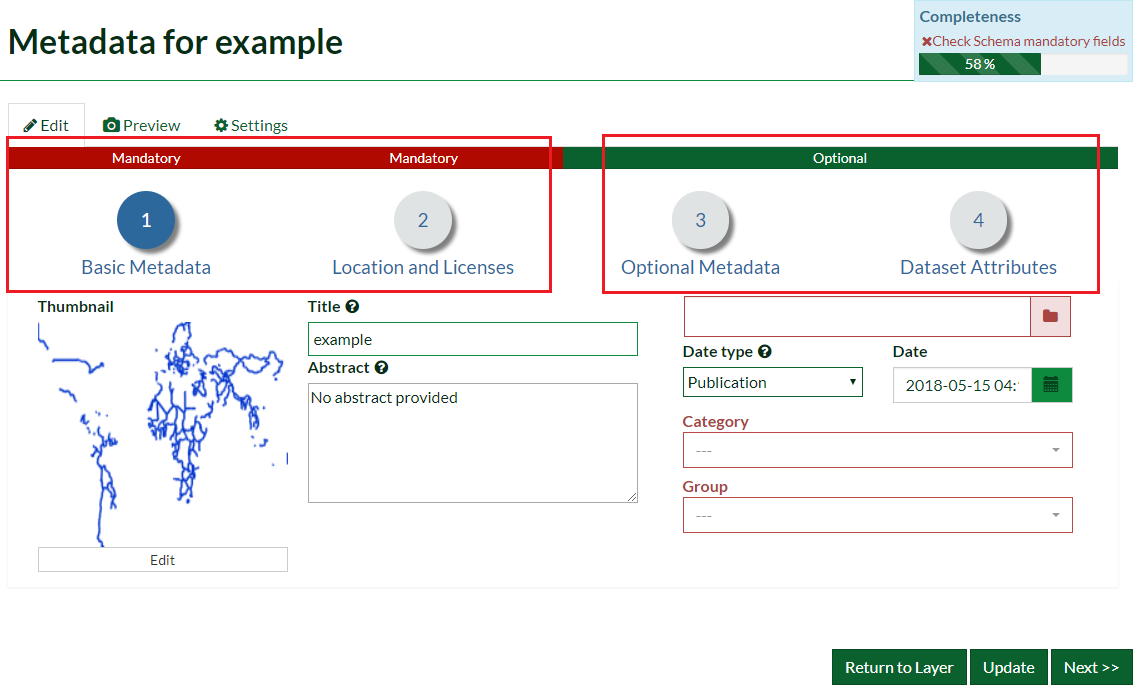
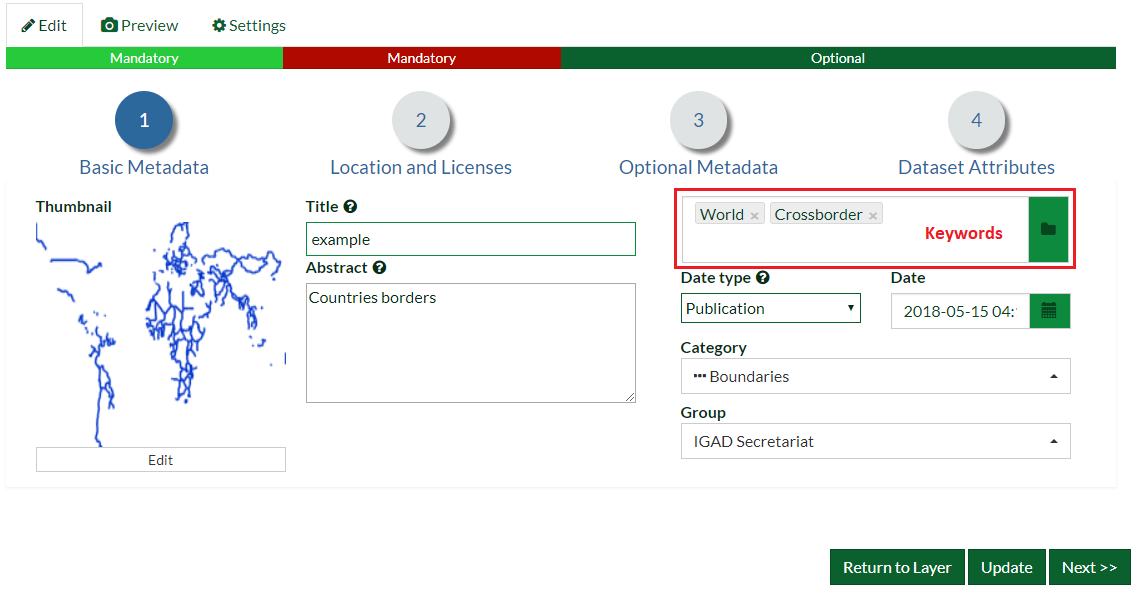
On the first page, Fill the form by adding an Abstract. Assign the appropriate Keywords, a Category and a Group related to the layer. You can also edit the Thumbnail.
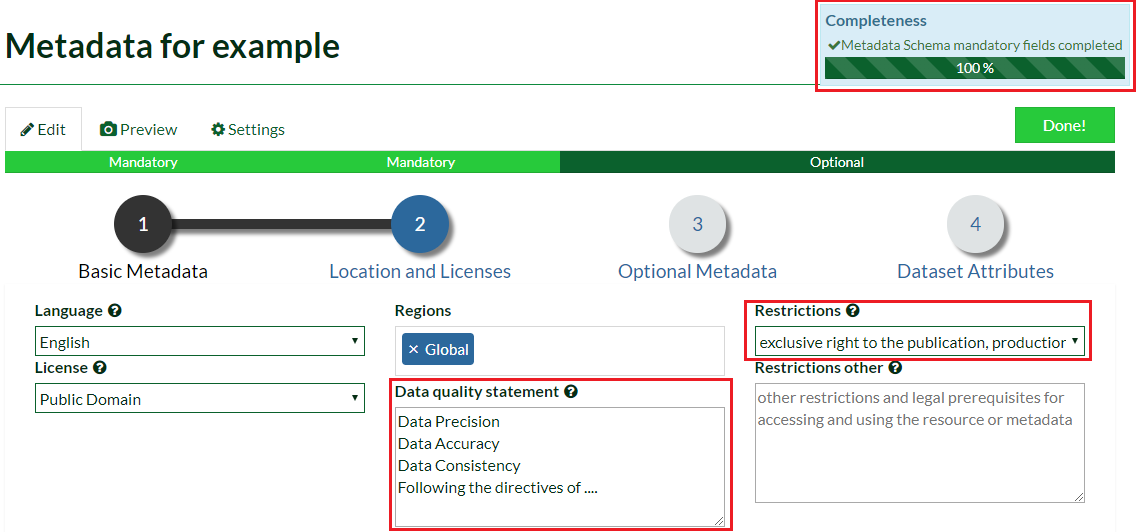
On the second page, you can set the language, the license, Data quality and the restrictions. Fill the required fields.
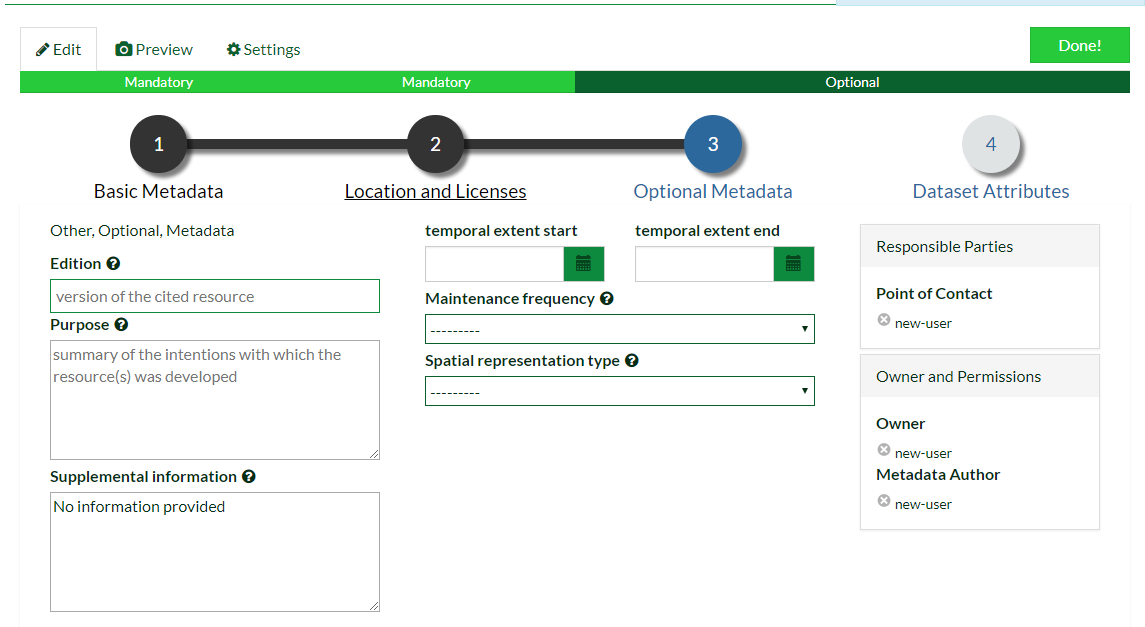
On the third page which is optional, you can add further metadata such as the purpose, temporal extent and the spatial representation of the layer.
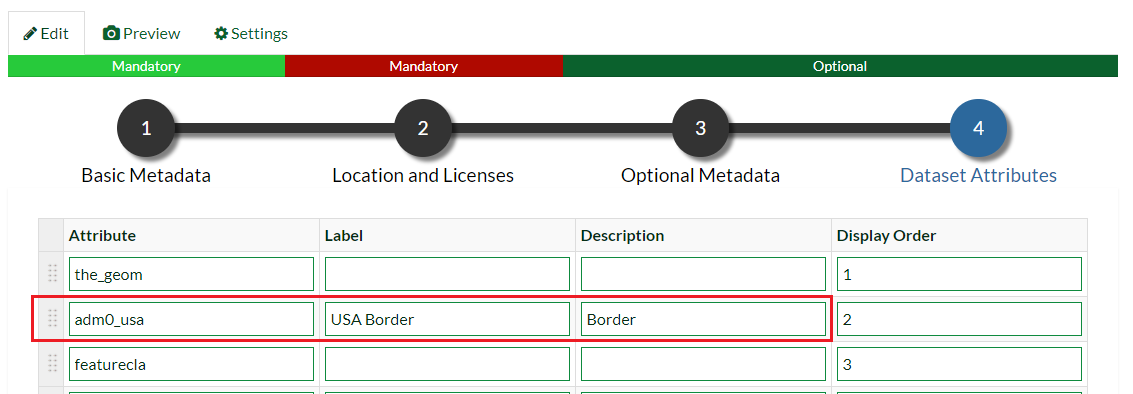
The fourth page named Dataset Attributes is optional but important since it allows you to compute some edits on the attribute table such as the labels and the order of the features. Adding a label to the attribute will speed up the process of the GetFeatureInfo operation. Click on Update after finishing your edits.
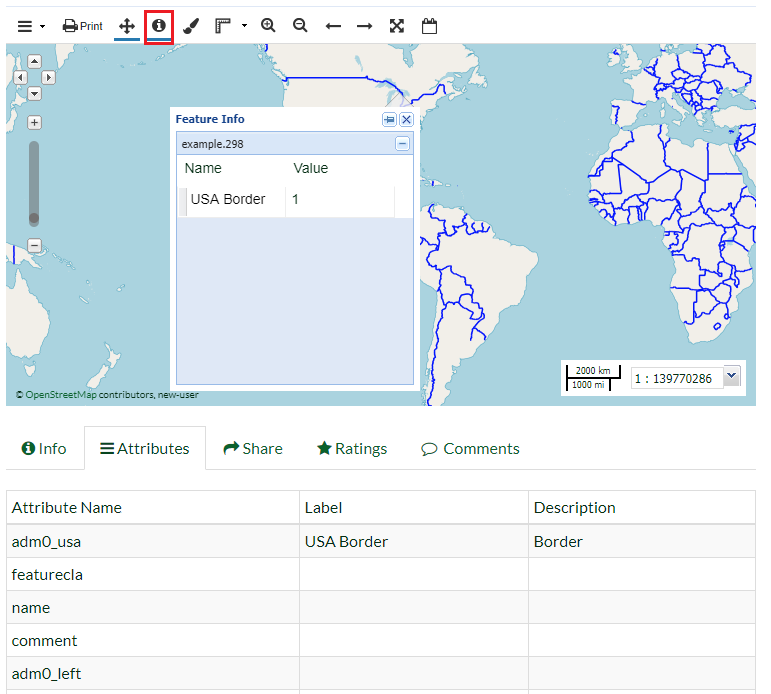
After updating the metadata you will be redirected to the preview page. Click on the Attributes tab to see your modified table. Click on GetFeatureInfo icon highlighted in the figure below and point it to a modified element. Note that the GetFeatureInfo will show you now the label added before.
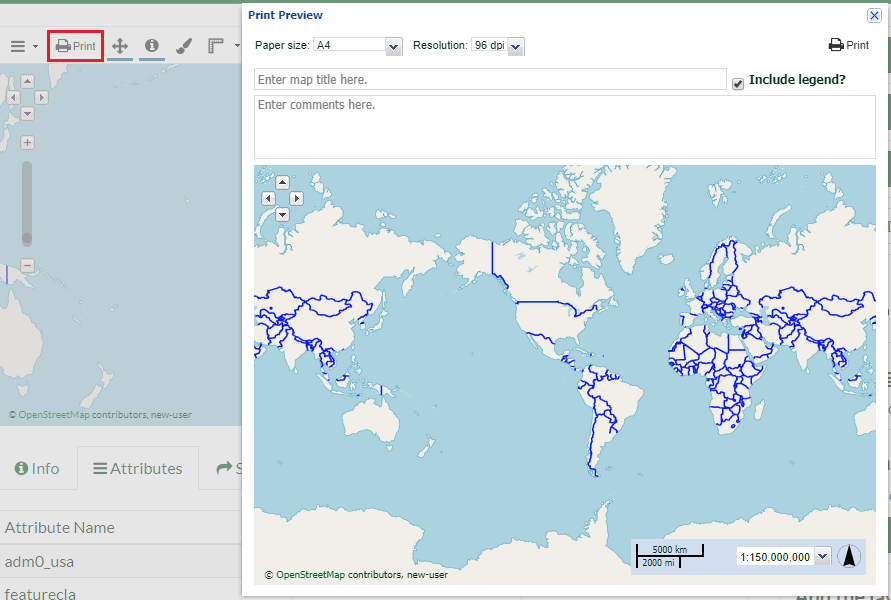
Finally, you can also print your map layer by clicking on the Print icon.
Layer Styling
First let us create a new style and assign it to the layer, next we will see how to manage existing styles.
Creating New Style
From the preview page, Click on Edit Layer. A pop window will open, in Styles you can edit the style, upload your own style (as an SLD) or manage the existing styles.
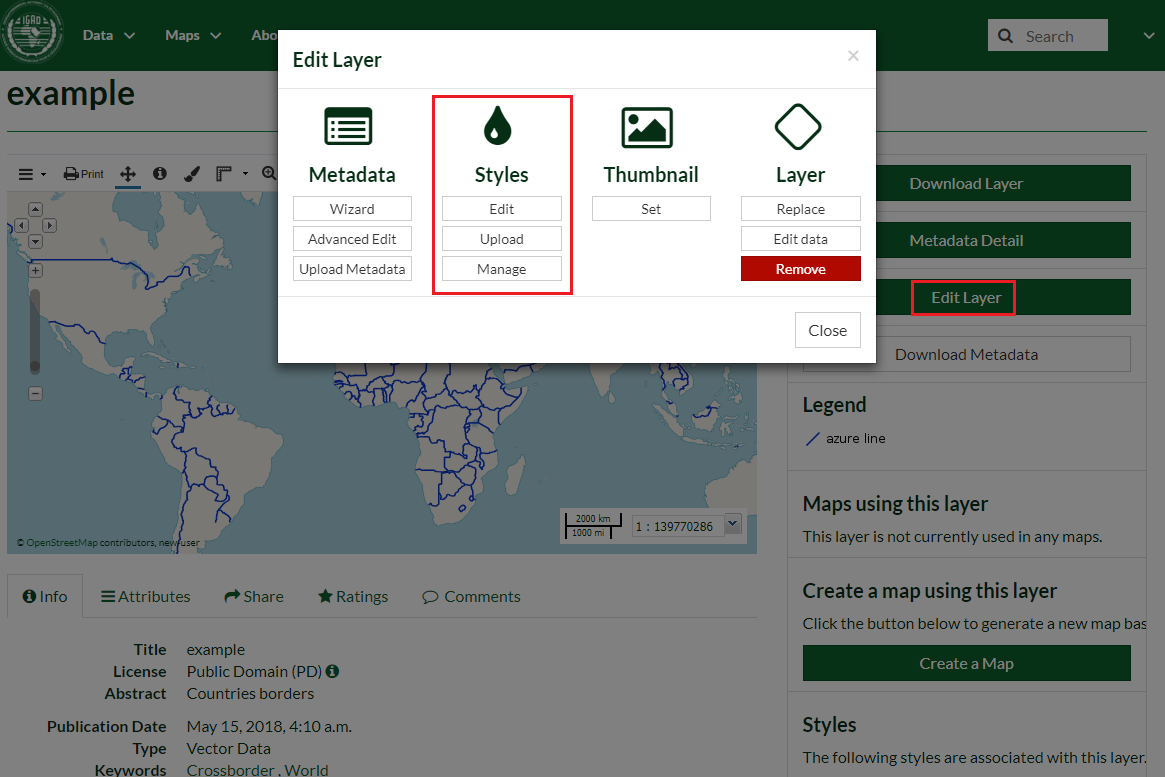
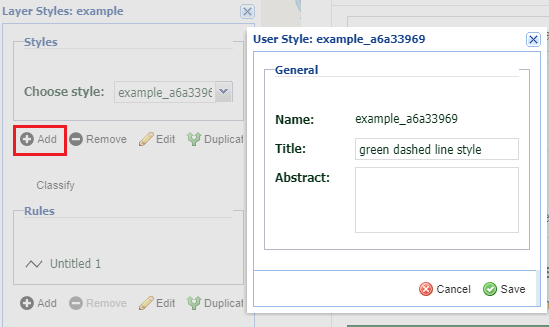
Click on Edit. A pop up window will open. Under the Styles part Click on Add to create a new line style. Assign a title and optionally an abstract then Save it.
Under the Rules part Select the Untitled 1 rule then Click on Edit. On the new window under the Basic tab you can change the name, style, colors, width and other properties.
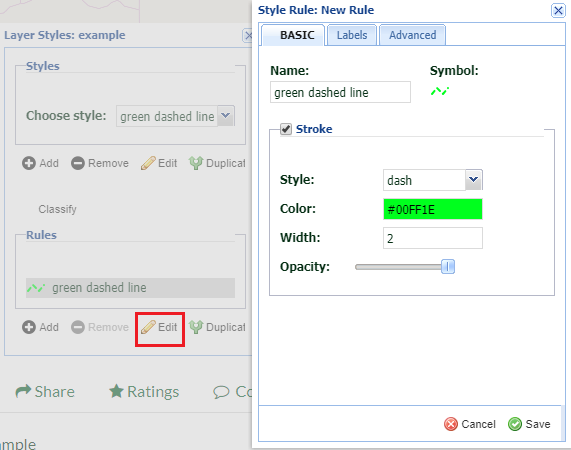
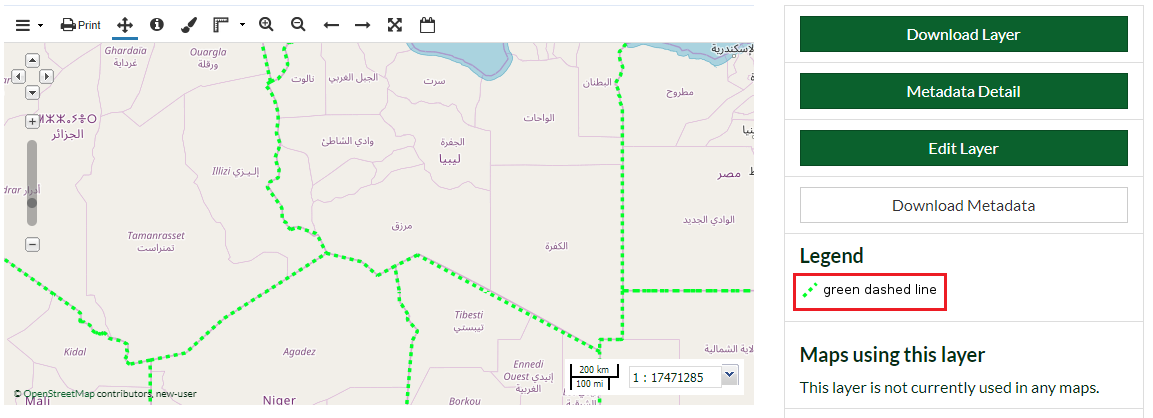
Change the properties of the style then Click on Save. The style of the layer will be updated.
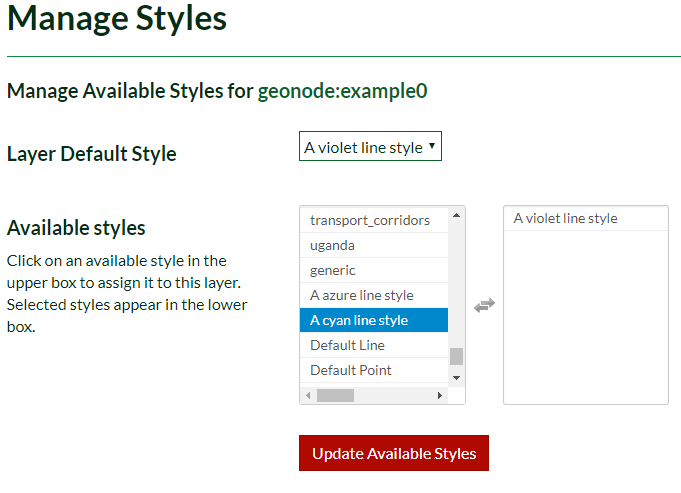
Managing Styles
As in Steps 1 - 2 in Creating New Style, now Click on Manage button instead. Choose an available style then Click on it. It will be automatically added to right list. Set it as Layer Default Style then Click on Update Available Styles.
Once you have finished all your edits on the layer. Return to the welcome page and Explore your layer, only you will be able to visualize it since it still in a Pending Approval state.
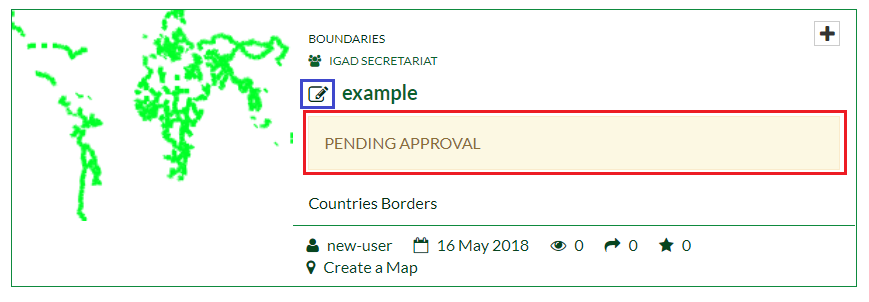
In the figure above, The icon highlighted in blue means that the layer was uploaded from a local machine.
Managing Temporal Data
Temporal data is stored in fields in the attribute table of a shapefile. Each feature can have a date/time value that represents the temporal event or a begining and end time stored in two different fields. Temporal data combined with spatial data is essential to analyze the evolution of a specific phenomena.
Uploading Data
Since IGAD portal leverages on GeoNode, it allows the user to upload vector data storing temporal fields. As seen before, the upload procedure of a layer is the same.
From the top menu, Scroll down the Data menu then Click on Upload Layer. This will open the upload form.
On the new page, you can upload multiple layers concurrently and then configuring them separately.
Drag/Drop your multiple files in the Drop files here area. The files will be grouped separately and temporal dimension will be detected automatically.
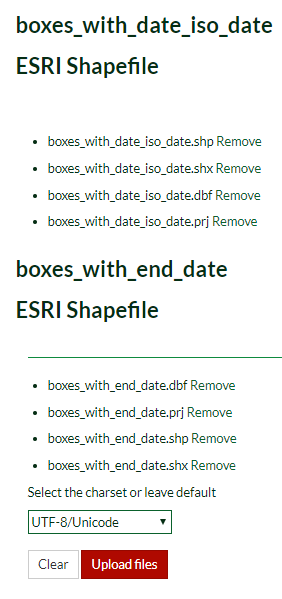
Click on Upload files button.
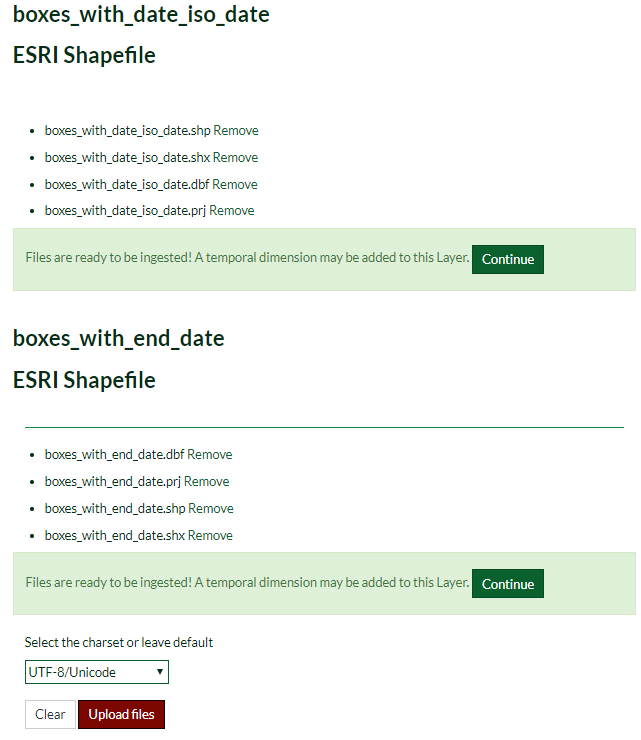
By clicking on continue you can setup the first shapefile on a new popup page and the second on an another one.
Click on Continue button of the second shapefile. You will be addressed to a popup page to setup the temporal field(s).
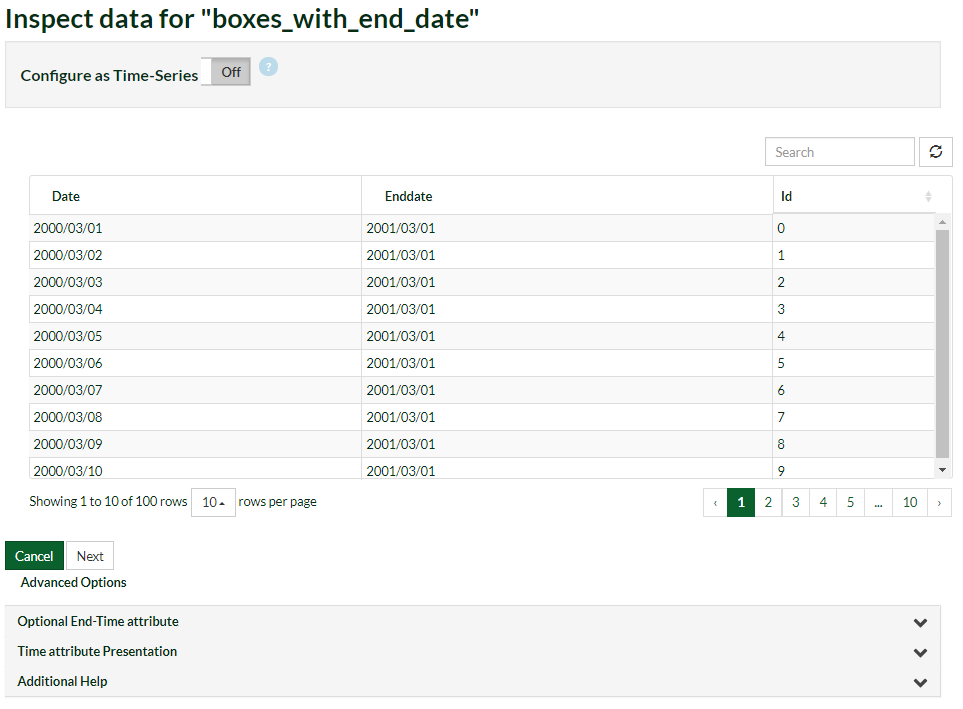
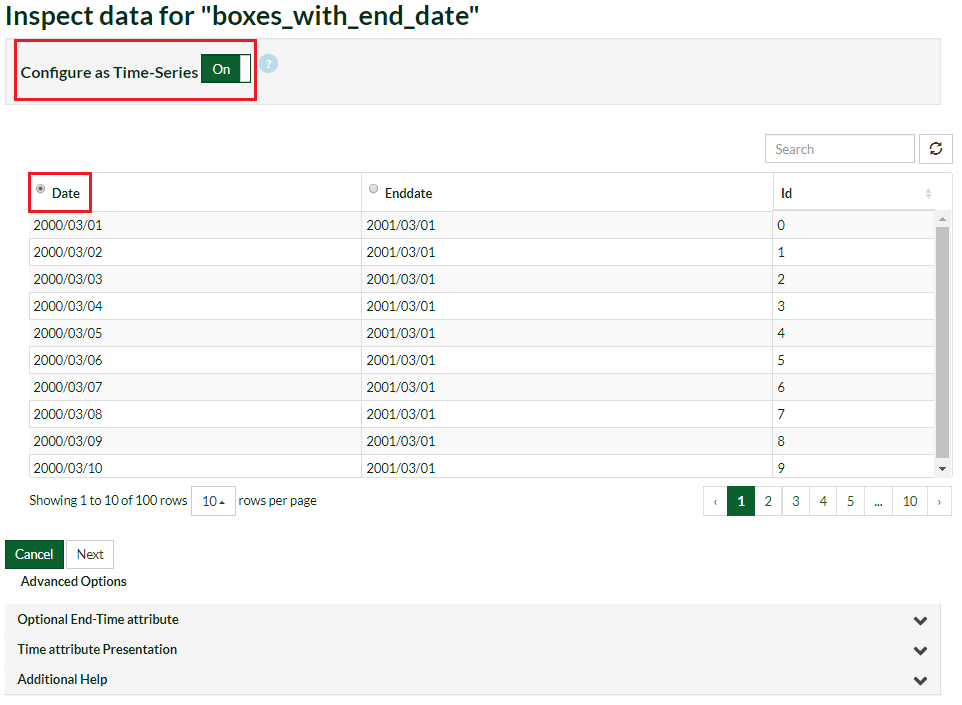
Switch on the selector to configure the file as a time series. Check the Date field.
Since the layer has a begining and an end temporal fields, you can set the End-time attribute in the advanced options. Expand the Optional End-Time attribute menu. Check the box then Select from the list the enddate attribute.
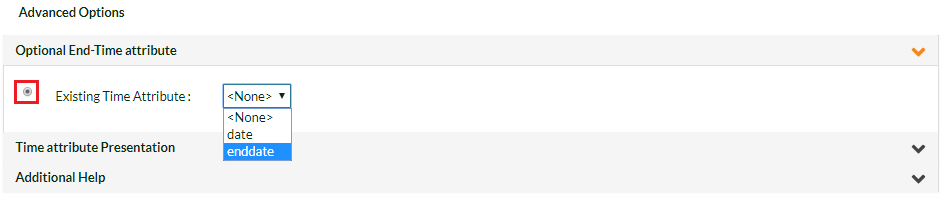
Note
Step 3 is not necessary in case the shapefile has a unique temporal field.
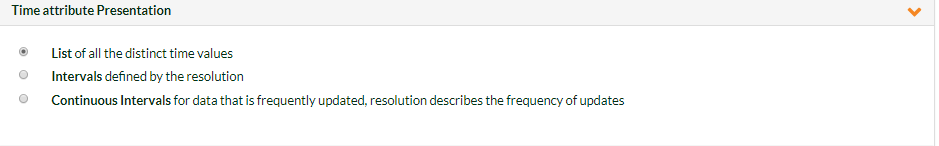
On Time attribute Presentation menu, Choose the appropriate field. In this case is a list of dates. Read the additional help menu to understand better date/time formats.
Click on Next. The shapefile will be uploaded. You will be redirected to the preview page and a time slidebar will be automatically enabled.
Managing Remote Services
A Web map service (WMS) is a standard protocol that describes how to serve any georeferenced map images over the Internet, which is usually generated by a map server that uses data from a geographic information system database. WMS provides a simple way of requesting geo-registered map images using an HTTP interface.
IGAD portal allows the user to make use of data via a connection to a remote service (to a server). Let us start to see how to add a remote service.
Adding Remote Service
From the top bar, Scroll down the Data menu then Click on Add Remote Service.
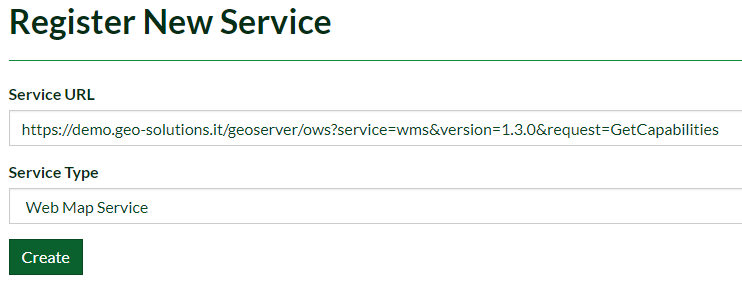
On the new page, you should provide a Service URL in order to connect to the server and a Service Type. There are three available service types.
- Web Map Service (WMS)
- GeoNode WMS
- ArcGIS REST MapServer
Adding Web Map Service
Let us connect, for example, to GeoServer at the following URL: https://demo.geo-solutions.it/geoserver/ows?service=wms&version=1.3.0&request=GetCapabilities. Copy the URL in the Service URL field and Select Web Map Service as a Service Type. Click on Create.
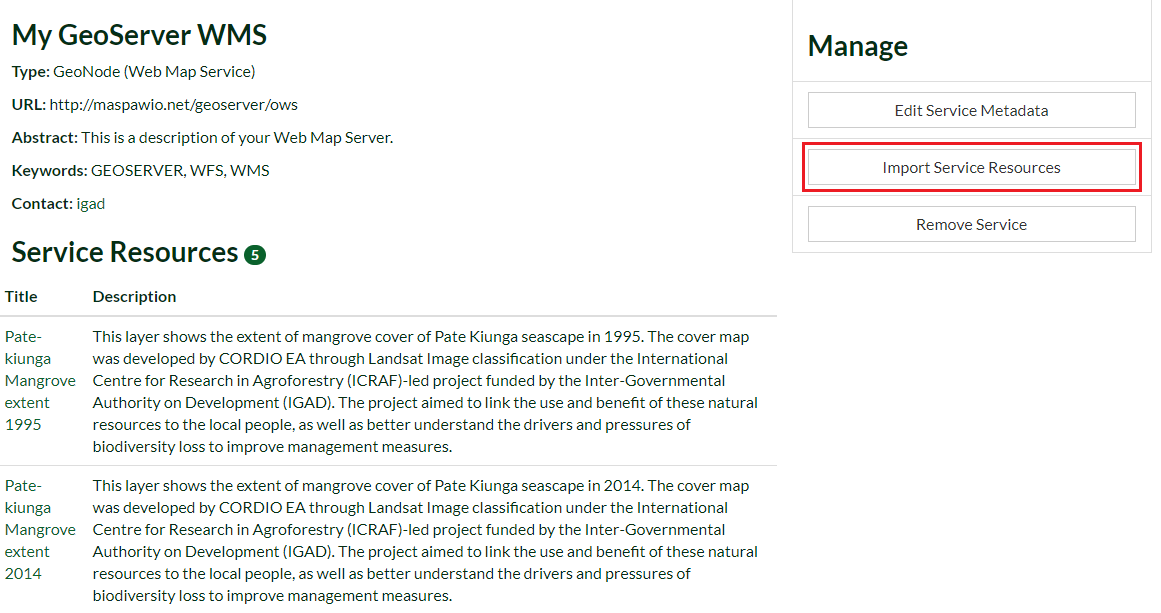
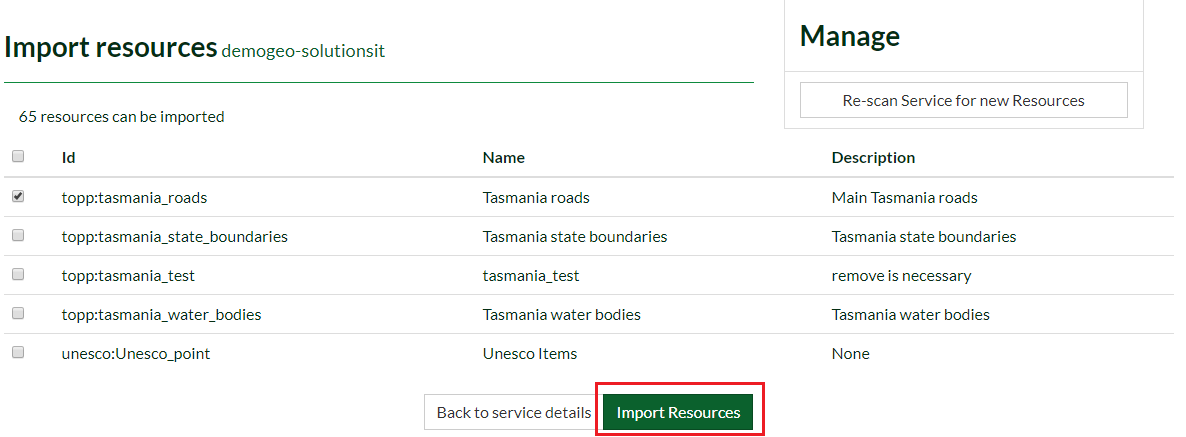
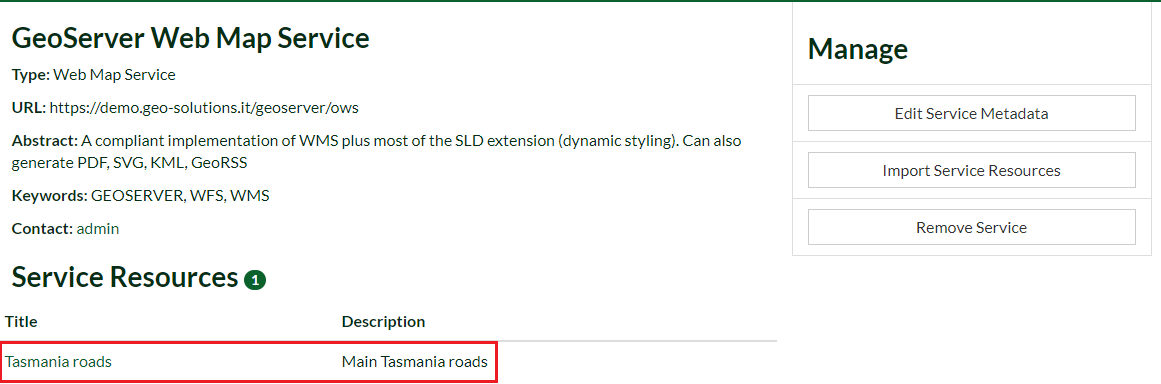
You will be connected to GeoServer and on the new page you will be able to view and to import any layer contained in the server. Check the flag box on a layer then Click on Import Resources.
Click on Back to service details. Click on the imported layer, you will be addressed to the layer preview page where you can edit it or create a map from it.
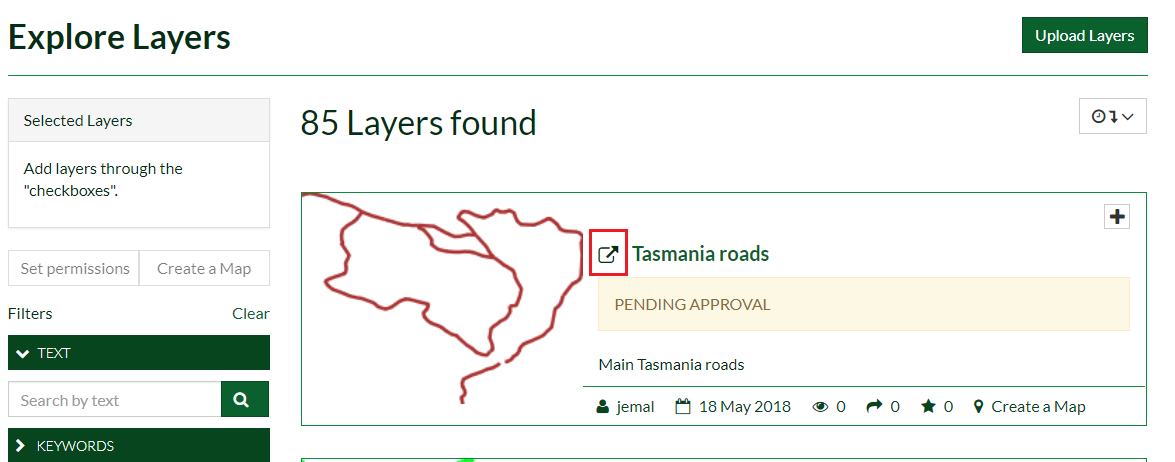
From the top bar, Explore all the available layers. You should find the imported layer. The highlighted icon in the figure below shows that the layer comes from a remote service.
Adding GeoNode WMS
Now, let us connect to GeoNode WMS using the following URL: http://ihp-wins.unesco.org/geoserver/ows. As above Add a new service using the latter link and Choose GeoNode as service type.
Note
Note that the provided URL now is different than the link in the first section. GeoNode will try to extract all the layers from the service and its metadata without pointing out in the URL the service type, the version and the request.
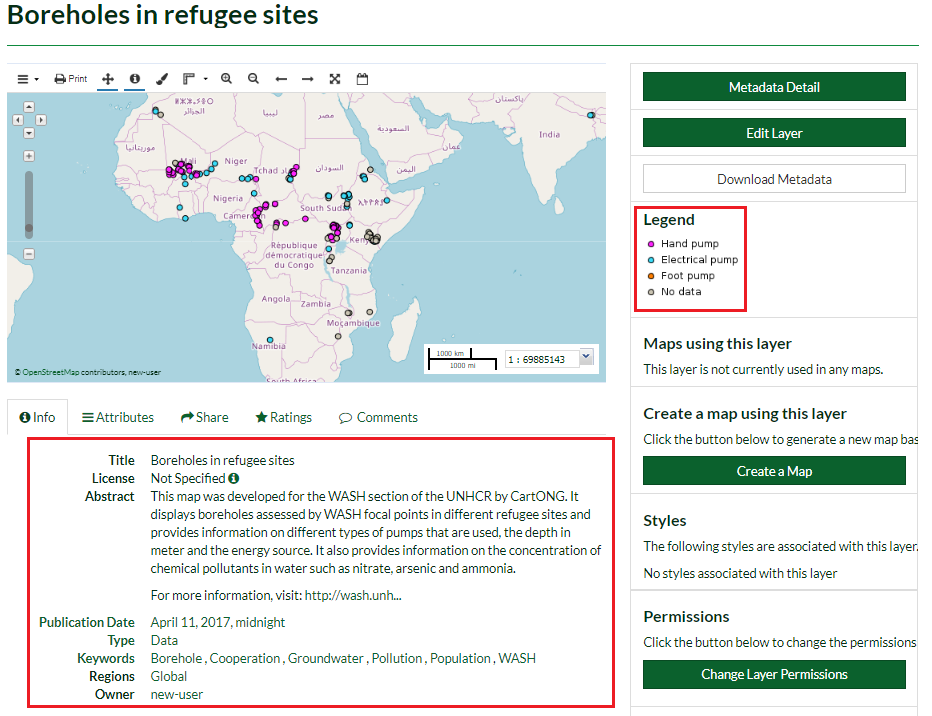
Import a layer and Visualize it. You will see that GeoNode WMS has imported also all the available info and metadata.
Adding ArcGIS REST MapServer
Dealing with ArcGIS REST services has some limitations and will be illustrated now.
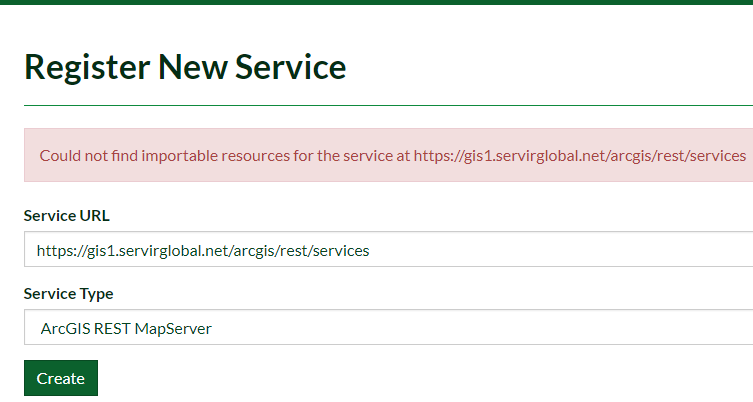
As an example, consider the following link https://gis1.servirglobal.net/arcgis/rest/services which is a remote service directory containing several layers.
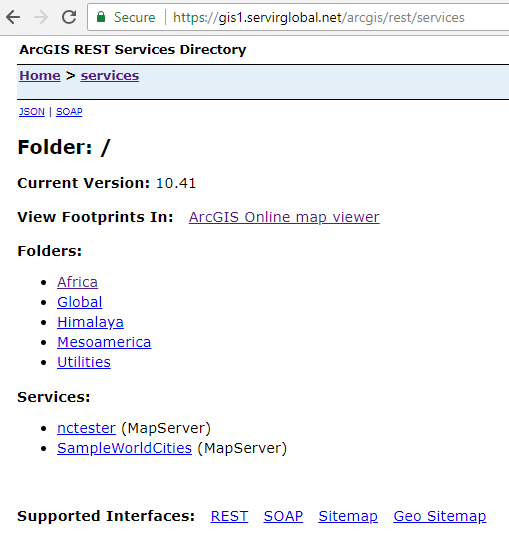
Add a new remote service using the link above. Select ArcGIS REST MapServer as a Service Type then Create. You will receive the following error. This is due to the indexing structure of the service.
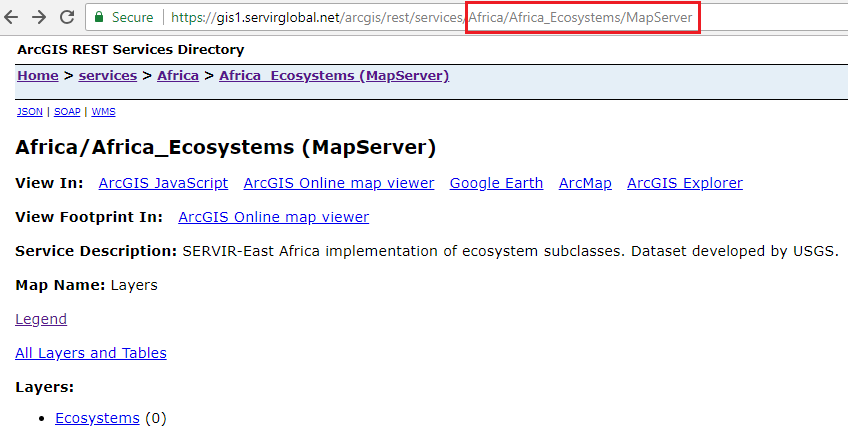
In order to avoid this error, one should point directly the root of the desired layer, for example, https://gis1.servirglobal.net/arcgis/rest/services/Africa/Africa_Ecosystems/MapServer. Create a new service using the latter link.
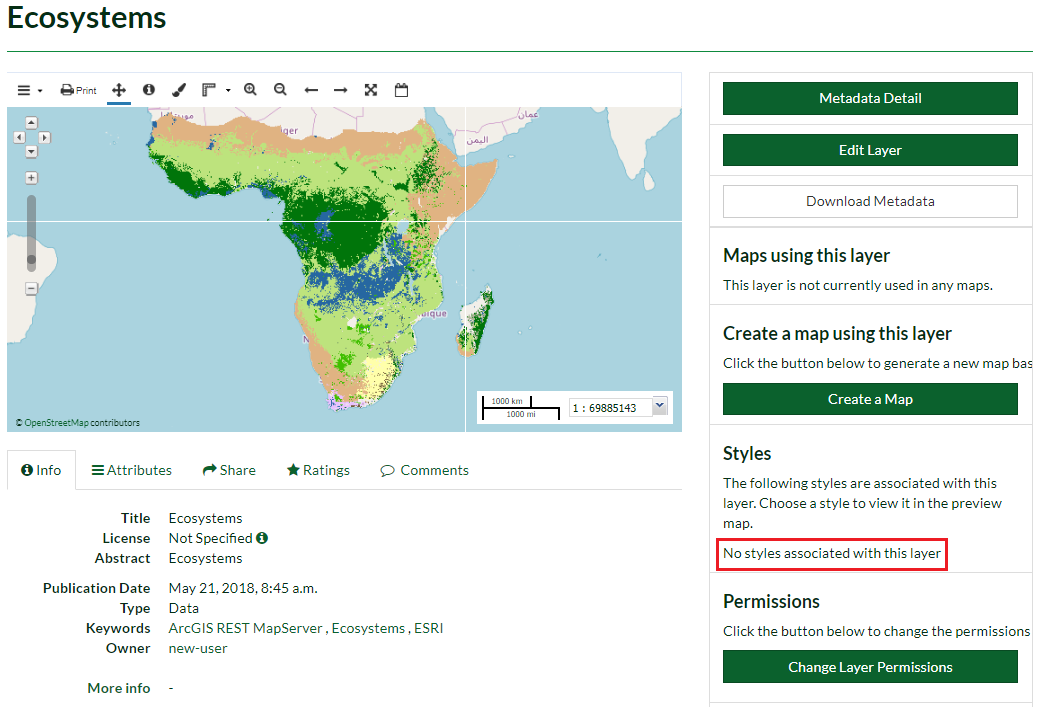
Explore the imported layer from the service. You will note that the Legend was not imported along the layer and thus you will not be able to change the style.
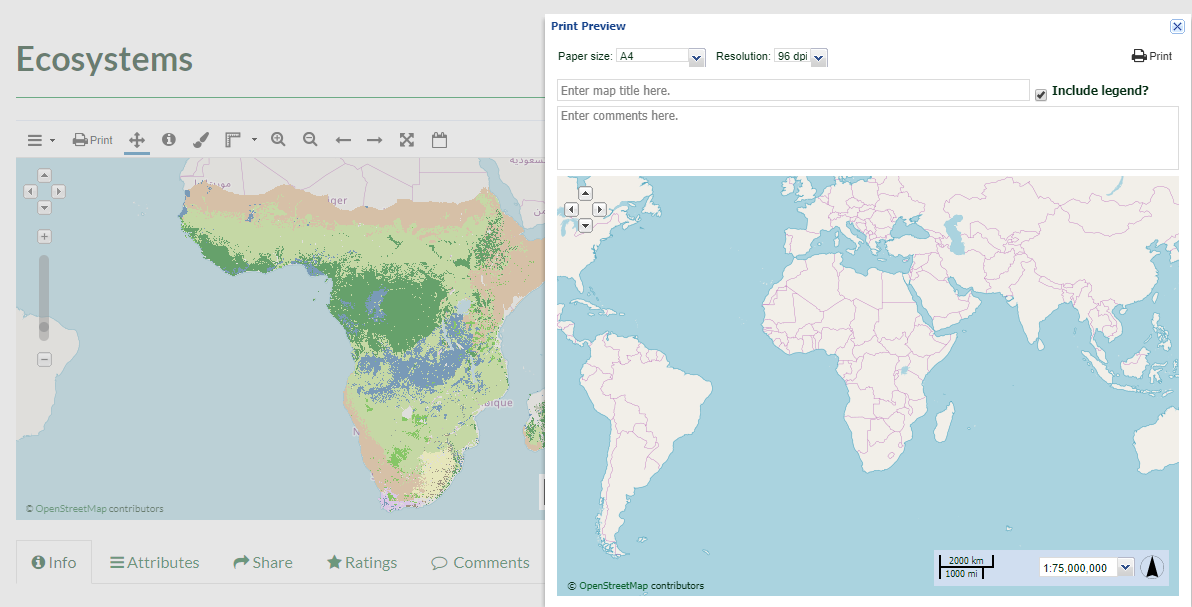
Finally, the layer will not be printable.
Exploring Remote Services
Scroll down the Data menu then Click on Remote Services.
Check the remote services in the portal created by other users.
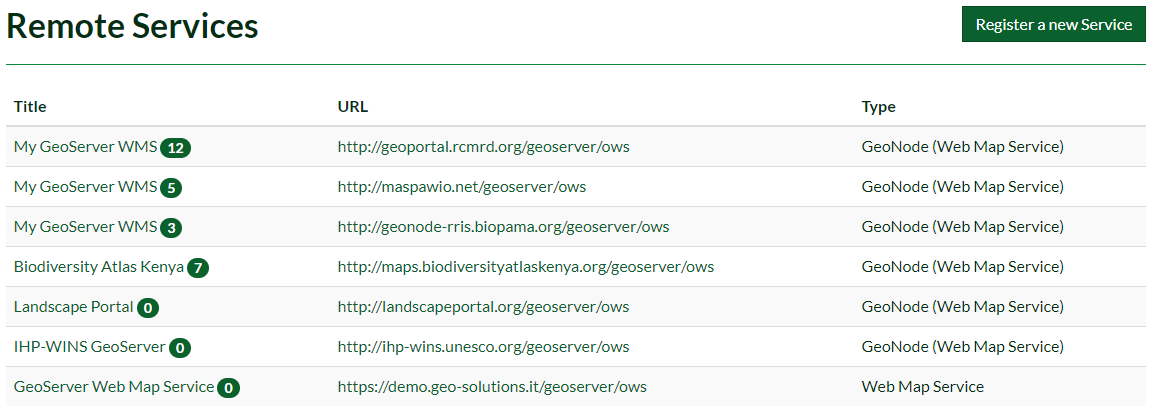
As a basic user you can only edit or delete your own created services. You can take advantage of the remote services added by other users importing from it some data.